Calculations and spreadsheets are a form of technical communication. Often calculations are shared by engineers to other engineers, bosses, even clients. When the calculation is shared it becomes communication! Learn how to create calculations that communicate effectively.
Hand-written Calculations
Engineering calculations are the heart of any design or analysis of laboratory data. They need to have more than just the right answer. They need to be formatted in such a way that a reader can understand the calculation and make sense of the answer. You should already be experienced at communicating effectively using calculations (i.e. homework problems).
Calculation Format
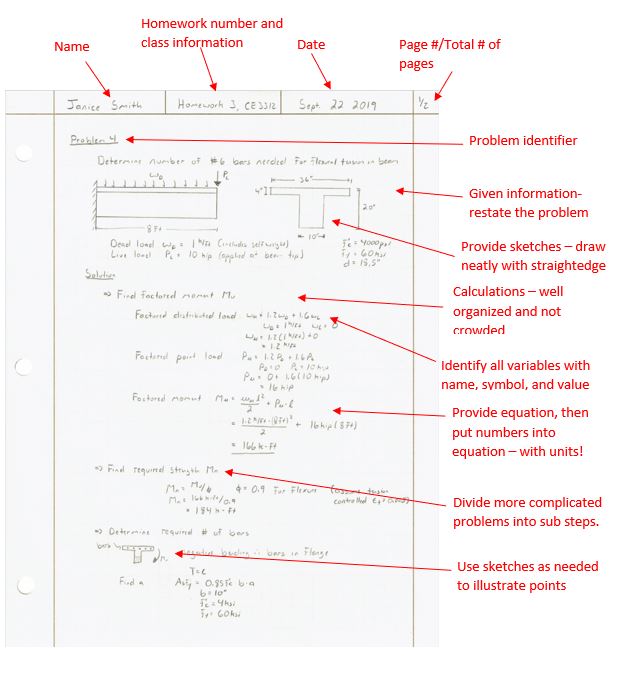
- Each sheet of calculations should have identifiers about the calculation. These include:
- Your name (or who did the calculation). Sometimes there is also space for who checked the calculation.
- The class/section for an engineering course homework or the company name for a professional design calculation
- The date (always date your work)
- Page number/total pages (let the reader know the total number of pages so they can know if one is missing)
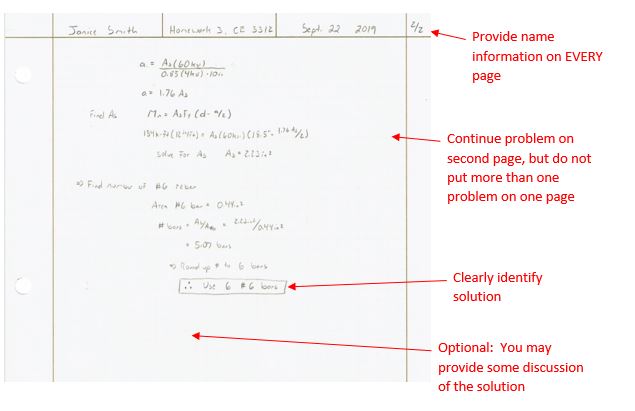
Many engineering calculations (and your homework problems) are hand written on engineering paper and most engineering paper has handy little boxes to put this information in at the top of the paper. If you work in a design company often then the company will often provide paper that will have spaces for this information.
The main box of the engineering paper is for well-written, legible, engineering calculations. Each problem or design should be organized in the following manner:
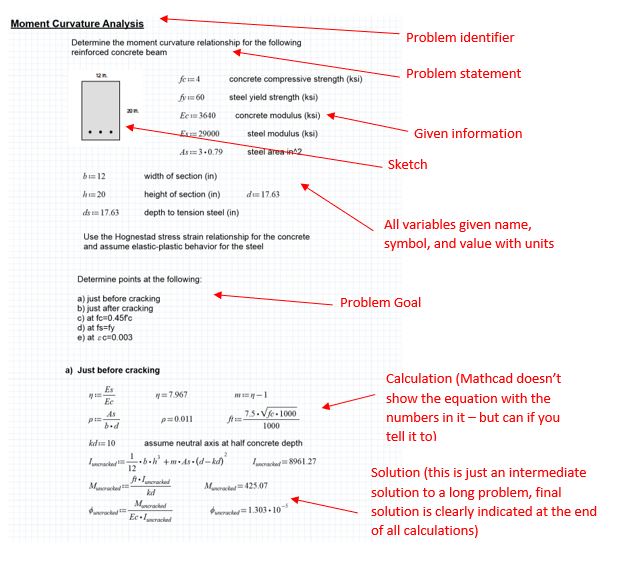
- Problem identifier. This can be the homework problem number, or an identifier for the design (i.e. Beam C2 shear calculation)
- Given information or assumptions. It is important that you restate your given information. This prevents the reader from the need to go back and try to find that information. If this is a homework problem then restate the assigned problem. If it is a design problem then you may include the design constraints or other given information. Always end this section with the goal of the calculation, what you are trying to find.
- Most engineering is very visual and a sketch of the problem is often very useful. Make sure the sketch is clean and well-drawn (use straight edges to help draw straight lines).
- Write out all the calculations required to get to the solution. Make sure that you provide a numerical example for every formula used. Be clear what your variables are. Make sure that you use units and the correct number of significant figures.
- Clearly indicate your solution (draw a box around it).
- If there is something interesting you want the reader to know about the calculation include it here.
Good Practices
The following suggestions will help with the creation of effective engineering calculations.
- There should be no more than one problem on each page. If you start a new problem start it on a new page. If your calculation exceeds a page then that is fine.
- Write in pencil not in ink. If you must erase something then make sure it erases completely (use the white drafting erasers). Do not leave smudges or cross-outs in your final calculation. This may mean recopying the calculation for a clean result.
- Write in print not cursive
- Use units in all your calculations (even went putting numbers into a problem). This greatly helps the reader (or professor) follow the work and helps you not make silly unit conversion errors.
- Use the correct number of significant figures for each calculation.
- Double check your work to make sure the math is correct.
- Provide the name, symbol, and value for all variables used. (i.e. “acceleration due to gravity (g) = 9.81 m/s”)
- Use blank space. Paper is cheap. There is no need to cram all your calculations in as small a space as possible. Spread out and make the calculations look good.
- For more information see: http://users.rowan.edu/~jahan/fatetransport/rowan_hw_format.doc.
Significant Figures
When presenting data, it is important to have the number formatted correctly as well. Pay attention to the number of significant figures in your data.
Number of significant figures indicates precision. Significant digits of a number are those that can be used with confidence, e.g., the number of certain digits plus one estimated digit. It is very important that numerical results be reported using an appropriate number of significant figures. Using too many digits implies a higher level of precision than was actually obtained in the lab procedure. Often putting a number in scientific notation makes it clearer the number of significant figures.
- The number of significant figures (non-zero numbers) used to report results should be appropriate to the sensitivity of the measurement.
Wrong: Young’s modulus, E, for aluminum was found to be 12601.01 ksi.
Right: Young’s modulus, E, for aluminum was found to be 12600 ksi.
It is impossible to determine a .01 ksi difference in E; therefore, 12601.01 contains an inappropriate number of significant figures.
- When adding or subtracting numbers, the result must have the least number of decimal figures from the measured data.
65.43 in.
1.245 in.
+ 0.4652 in.
Wrong: 67.1402 in.
Right: 67.14 in.
- When multiplying or dividing numbers, the result must have the least number of significant figures that occur in all numbers.
0.156 × 84.24 × 1.7854 = 23.5 (not 23.4655)
Because 0.156 has the smallest number of significant figures (3), the answer is only meaningful to three significant figures.
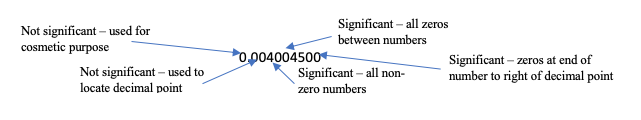
- 53,800 How many significant figures?
5.38 x 10⁴ 3
5.380 x 10⁴ 4
5.3800 x 10⁴ 5
Zeros are sometimes used to locate the decimal point not significant figures.
0.00001753 4
0.0001753 4
0.001753 4
Error and Percent Difference
For a quantitative comparison you will often need to present the error or the percent difference. Percent error is used when you are comparing an experimental result to a theoretical calculation, or in comparing two values in which you take one as the reference.
Percent Error Formula
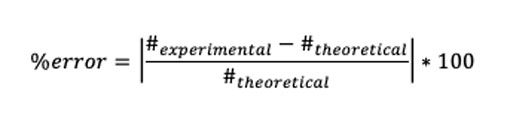
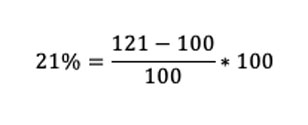
Often in the lab reports you are asked to compare two values. For example, the tensile strength of a sample of CFRP was 121 ksi and rebar was 100 ksi. If you say “The tensile strength of the CFRP was 21% higher than the rebar.” Then you are making a percent error calculation where the CFRP is the experimental value and the rebar is the theoretical value. When you say “higher than rebar” then the rebar strength is the reference and becomes the value in the denominator.
Percent Error Example
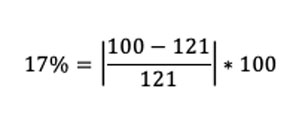
If you say “The rebar’s tensile strength was 17% less than the CFRP”. Then you are making the percent error calculation using the rebar as the experimental and the CFRP as the theoretical. The “less than CFRP” means that the CFRP strength become the reference point and the value in the denominator.
Percent Error Example
Percent difference is used when you are comparing two experimental results. For example, if you measure diameter of a cylinder twice and read two different numbers.
Percent Difference
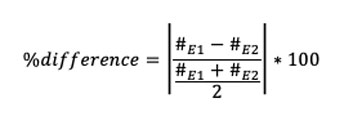
For example, if measurement one is 0.5467 in. and measurement two is 0.4967 in. then the percent difference is 9.584% (notice the correct number of significant figures).
Examples
Spreadsheets
More and more spreadsheets are being used to create engineering calculations, but that doesn’t mean that they are a table of a bunch of numbers. Use the spreadsheet to its best advantage and organize the sheet so that you have calculations that communicate effectively.
Format
Many of the same rules apply to spreadsheet calculations as to hand-written calculations. The major benefit of a spreadsheet is that they are calculation tools. Once you have one setup, then you can make changes to inputs (like different length beams) and the spreadsheet can be made to automatically update the solution. This is a major benefit when making repetitive calculations. However, if it is to serve as a design calculation (or you are going to show it to anyone else) you want someone to be able to follow your work. This means that you need to:
- Provide a problem identifier. This can be the first couple of rows of the spreadsheet, or the name of the tab (only if the spreadsheet is to be only viewed electronically)
- Provide the given information or assumptions. It is important that you restate your given information. This prevents the reader from the need to go back and try to find that information. In a spreadsheet you can use highlighted cells or different color fonts to differentiate between information that is constant and information that the user inputs.
- You may think that you can’t use a sketch in a spreadsheet…but you can! More importantly you should use sketches just like you do in hand calculations. Just like in Word, Excel will let you draw and write equations. You can even draw something by hand if needed and insert the picture into the spreadsheet.
- Write out all the calculations required to get to the solution. Spreadsheets like to hide the calculation in the cells. If the spreadsheet is to be printed to be shared, make sure that you show the calculations or write the calculation in the cell beside the solution. Be clear what your variables are. Make sure that you use units and the correct number of significant figures.
- Clearly indicate your solution.
- If there is something interesting you want the reader to know about the calculation include it here.
Good Practices
Spreadsheets provide some unique calculation capabilities. Below are some suggestions for good spreadsheets.
Don’t let your spreadsheet be a page of numbers. Use the formatting features available in Excel such as borders, highlighting cells, and font colors to indicate different types of information or areas of calculation.
Don’t make the spreadsheet too large. Use the tabs in Excel to help organize your workbook, especially if the calculations is long.
Use units! The number does not mean anything unless there is a unit.
Watch significant figures. Excel automatically fills up the cell with the result of the calculation, but typically you do not need to many significant figures. Go ahead and tell Excel how many to use in that cell(s).
Provide notes and information throughout the spreadsheet to help the reader follow the calculation.
Examples
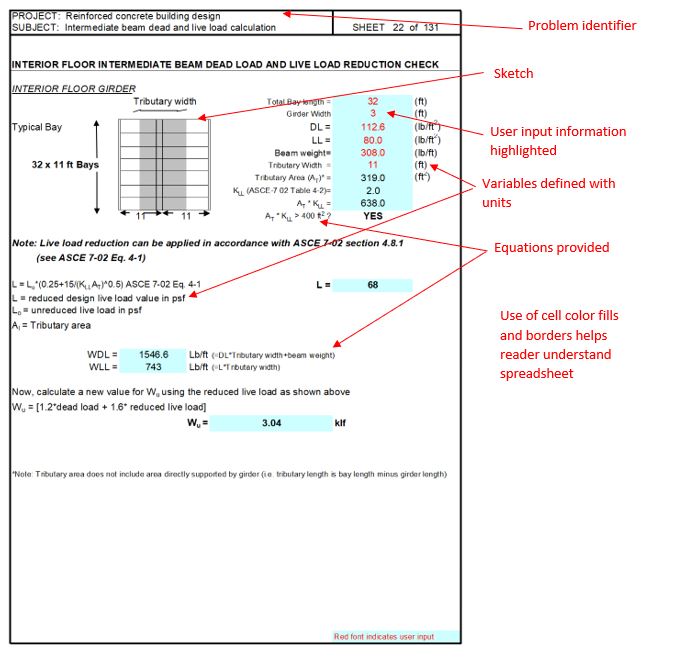
This example shows a spreadsheet that can be printed and used as a design calculations (or homework solution)
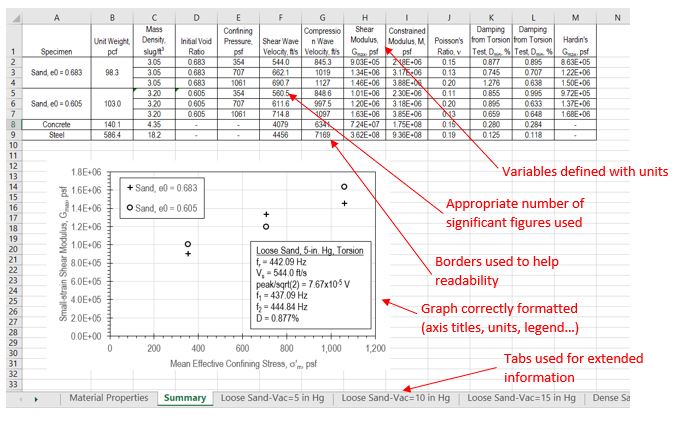
This spreadsheet shows information entered or calculated in a table used to make a graph that would be part of a design or lab report. The spreadsheet could be made available electronically to those wanting the data.
Other software
Beyond Excel, there are several different software programs that can make writing engineering calculations easy. For example, Mathcad is a great tool for creating engineering calculations that calculate themselves. The free Express version is able to do simple calculations such as the one shown here.