Figures are visual depictions of your ideas and data. Learn about how to cite figures and use some automatic citation features in Microsoft Word. Also learn some suggestions for good figure formatting.
Citing
All Figures need to be cited. Every figure must have a figure number and brief caption. The number and caption are placed on the same line below the figure. In addition, you must call out or cross-reference the figure in the text of the report (before the figure appears). In the cross-reference use the capital “F” in figure since you are referencing a specific figure (treat it like a name). The caption should be descriptive and inform the reader of the important point of the figure. For example, say more than just “Stress vs. Strain,” say something like “Stress vs. Strain of CFRP and #3 Reinforcing Bar.” The numbering must be in the order that the figures appear in the report. If you move/add/delete a figure you have to change the number. If the report is long, you may consider using chapter numbers with the figures. For example: “Figure 3-2”. If you are writing in Word, then there are automatic features that help keep track of your figure numbers and cross-references. This is especially beneficial in long reports in which you may change the order, or add/delete figures. Word will automatically update the numbers and cross-references.
Example

Using automatic citing features in Word
In Word, under the references tab choose insert caption. You can choose whether the caption is a Figure, Table, or Equation. Word automatically formats the caption with blue text. This can be changed by changing the caption style under the home/styles tab. You can also choose to include chapter numbers (but you must have chapter numbering set up in the document). Word will automatically assign the figure number based on where it falls in the text. If you move the figure then updating fields (selecting and hitting F9 in a PC) will automatically update the figure number.
For cross-references, go under Insert-Links-Cross references. In the window, choose the reference type as a figure and then under “insert reference to” select “only caption and label”. Word will automatically update cross-references if your figure numbers change. Warning – Word only updates when you print, or tell it to update fields. Sometimes you may move something around that breaks the link and you will be left with an “Error reference not found” in the text instead of the number when you go to print or submit. Be sure to update all fields before submittal to make sure there are no errors.
Formatting
A well formatted figure displays the needed information in a clear and easily readable format. Below are some suggestions for figure formatting.
- Use a readable font. Sometimes you will make a figure larger in Excel or other program then shrink it down to fit in the report. Make sure you are not making any font sizes smaller than 8pt.
- Use axis labels with units. Data does not mean anything if there is not a unit. Use dual units if required.
- Axis values (numbers) should use the appropriate number of significant figures. Make sure that the axis does not appear to crowded.
- Adjust the range so that the data is well displayed (Sometimes Excel will give a negative axis range even if just a few points are
slightly negative. You may consider adjusting the axis bounds.) - Do not use the figure title. In excel you can title a figure, but when you put the figure in a report the caption is the title. You need to delete any title above the figure.
- Make sure each series is clearly distinguishable. Red and blue color lines look the same if printed in black and white. Use dashes, dots, or maker options to distinguish the lines. Use the series legend if more than one series.
- Make sure the figure is overall readable and uncluttered. Use the correct series type. (If there are a lot of data points, don’t use the data markers. If the data points are independent, don’t use a series line)
- If the data is experimental – use a straight line to connect points.
- Be careful with gridlines. Sometimes they work, but often will clutter the figure. Consider tick marks instead.
Example: Poorly formatted figure

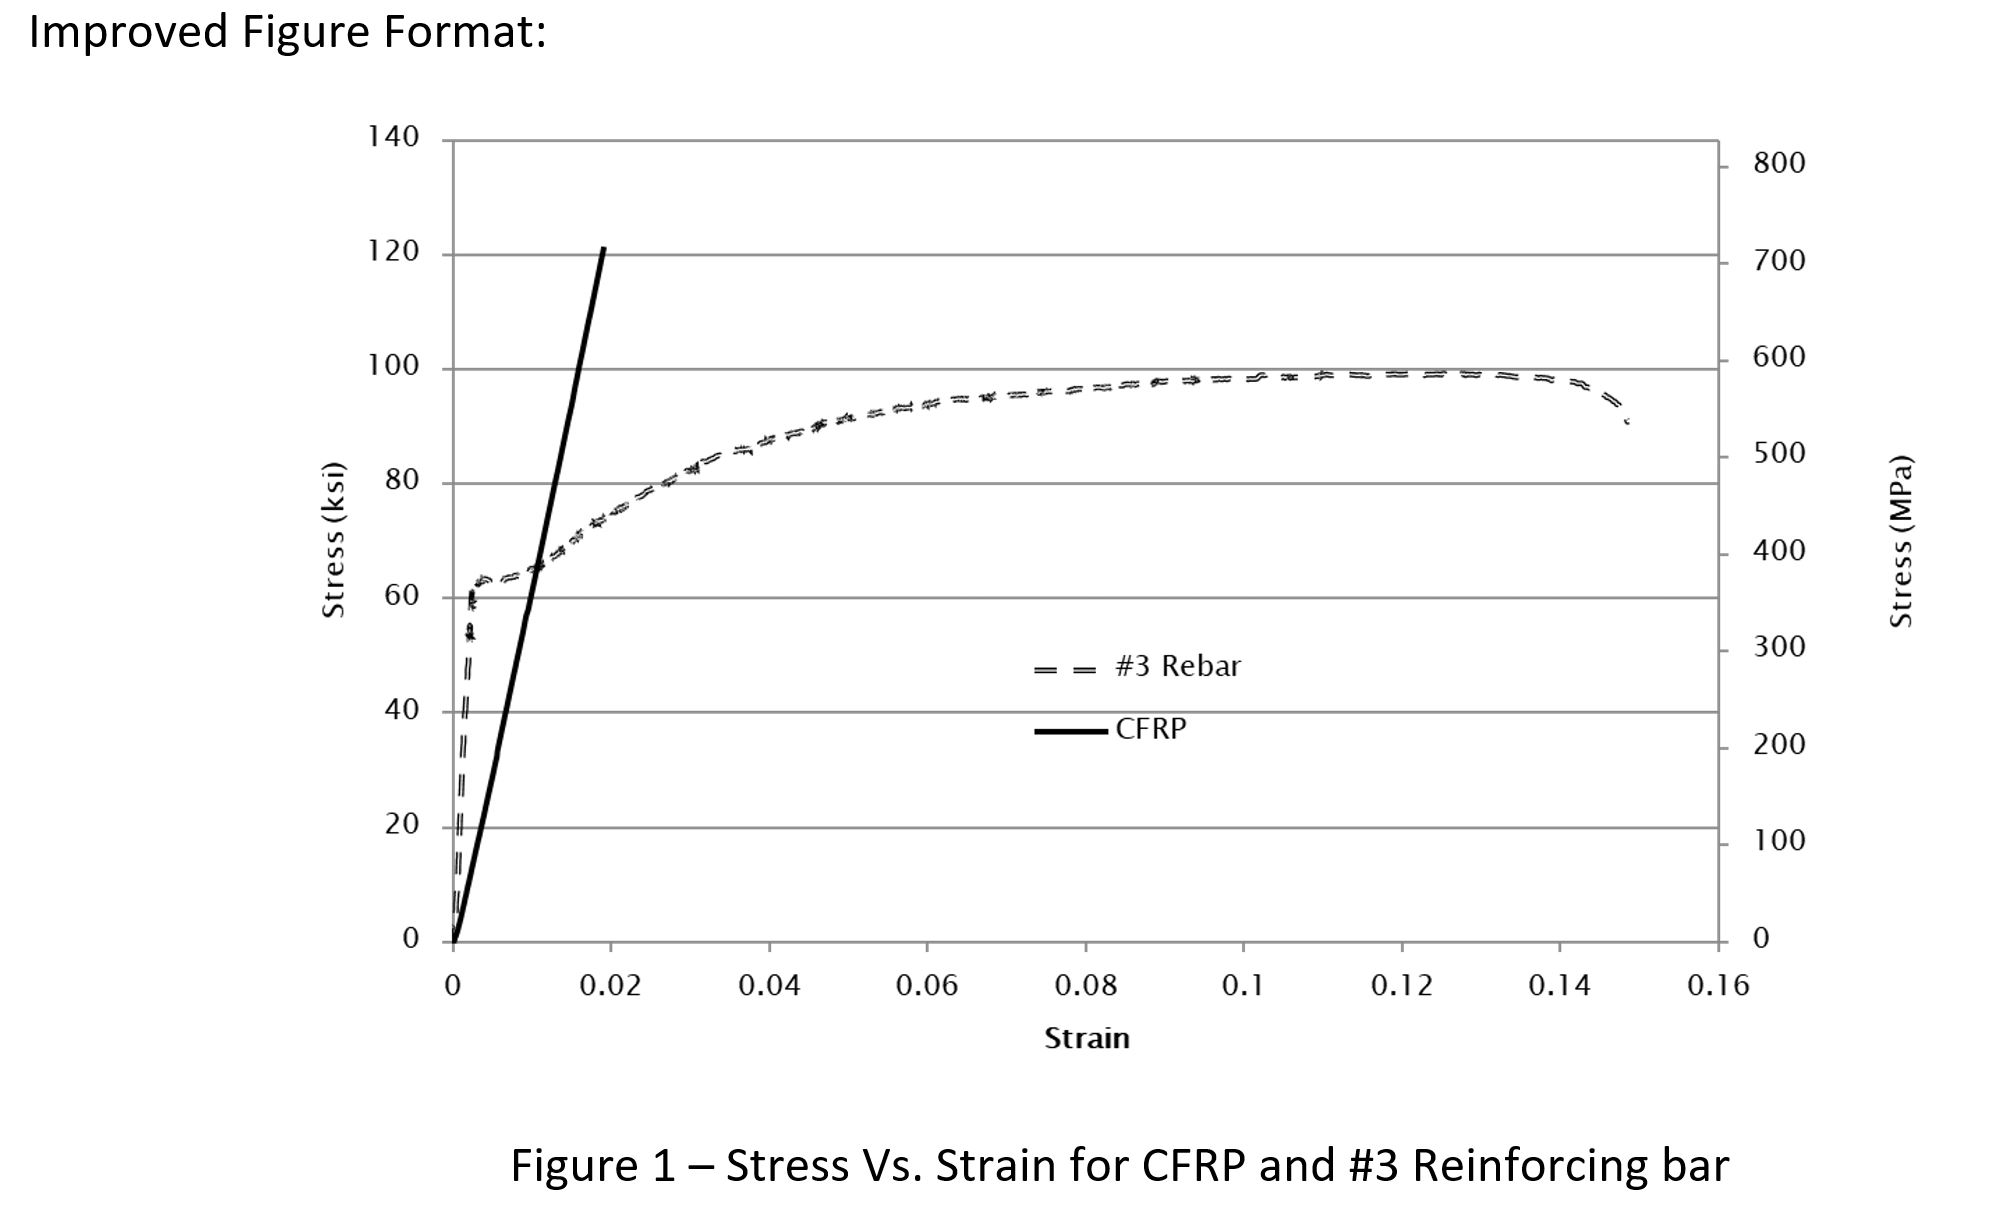
Example: Improved figure format